The Market Is Sitting At A 1929 Valuation Level – Will It Crash Next? (Back On Monday)

1/30/2024 – A mixed day with the Dow Jones up 133 points (+0.35%) and the Nasdaq down 118 points (-0.76%) 

The stock market continues to behave exactly as anticipated/projected. 

It has been a long time since we have looked at Shiller’s PE Ratio……

Why do I bring this up?

JPMorgan Warns Today’s Market Is “Far More Similar Than One May Think” To The Dotcom Bubble Peak

And I wouldn’t necessarily disagree.

As you can see we have been sitting at extraordinary valuation levels for nearly 10 years now. Today’s valuation levels are on par with 1929 and slightly below 2000 highs. But 2000’s P/E record is somewhat misleading as the index was heavily weighted in tech stocks that didn’t have any earnings.

Long story short, yes, absolutely, the stock market is once again selling at record valuation levels.

Having said that, it has yet to reach its top. As we have been suggesting for some time, the stock market will not complete this bull move until it hits its mathematical Time/Price point of force. If you would like to find out exactly where this point is, in both price and time, please Click Here

What The Hell Is Happening With This Stock Market? The Answer Is Very Simple

The stock market continues to behave exactly as anticipated. 

If you would recall, we saw complete Gloom & Doom at the end of October, with nearly everyone expecting some sort of a market crash.  Well, we didn’t, as we continued to maintain that all indices will see new all time highs before it is all said and done.

Today, most investors, professional or not, are dumbfounded by what they are witnessing.

Recession red flags: Wall Street and Main Street are at odds about the economy

    • The U.S. stock market may be at an all-time high, but the “Wall Street – Main Street disconnect” remains wider than ever — and that spells trouble ahead.
    • Specifically, there’s a dramatic difference in perspectives about the health of the U.S. economy. On the one hand is Wall Street celebrating the stock market’s new records, with many believing the Federal Reserve has avoided a recession by executing a “soft landing.”
    • Yet the average American is much more pessimistic. I receive numerous emails from readers describing significant and sudden slowdowns in their particular industries and widespread fears in their communities of how much worse it could become in coming months. And the data confirm what they’re saying.

The above is understandable, but our approach to the overall market analysis is rather simple.

You see, the overall market hasn’t yet completed its mathematical pattern that it needs to complete before any further downside is possible. Hence the confusion between today’s fundamental deterioration and the stock market’s apparent positive outlook.

In other words, the market must complete its pattern and hit its mathematical and timing points of force first.  And until that happens it will NOT go down. No matter what happens with the overall economy, geopolitically, etc……  It is as simple as that.

If you would like to find out exactly where this time/price point in, in both price and time, please Click Here

Why The FED “Put” Will Fail

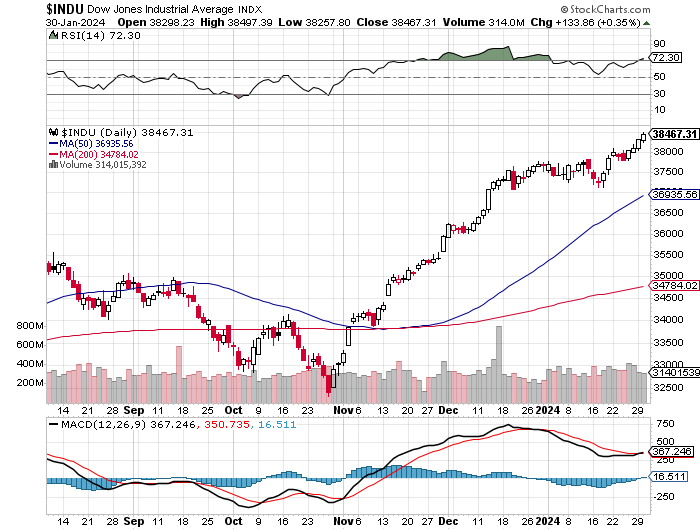
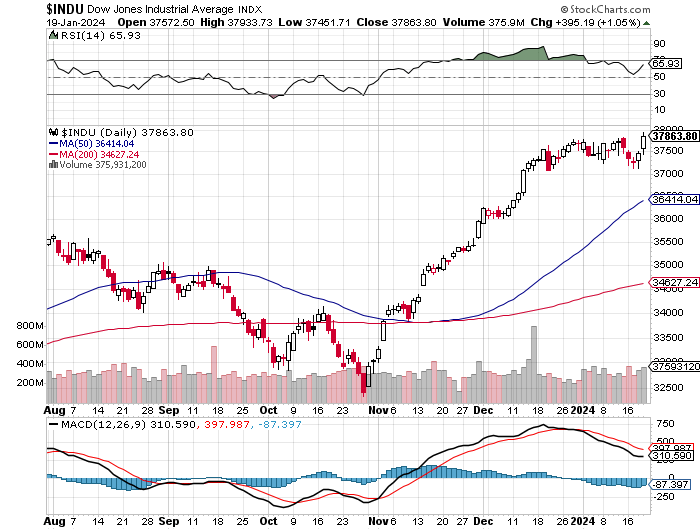
1/19/2024 – A positive day with the Dow Jones up 395 points (+1.05%) and the Nasdaq up 255 points (+1.70%) 

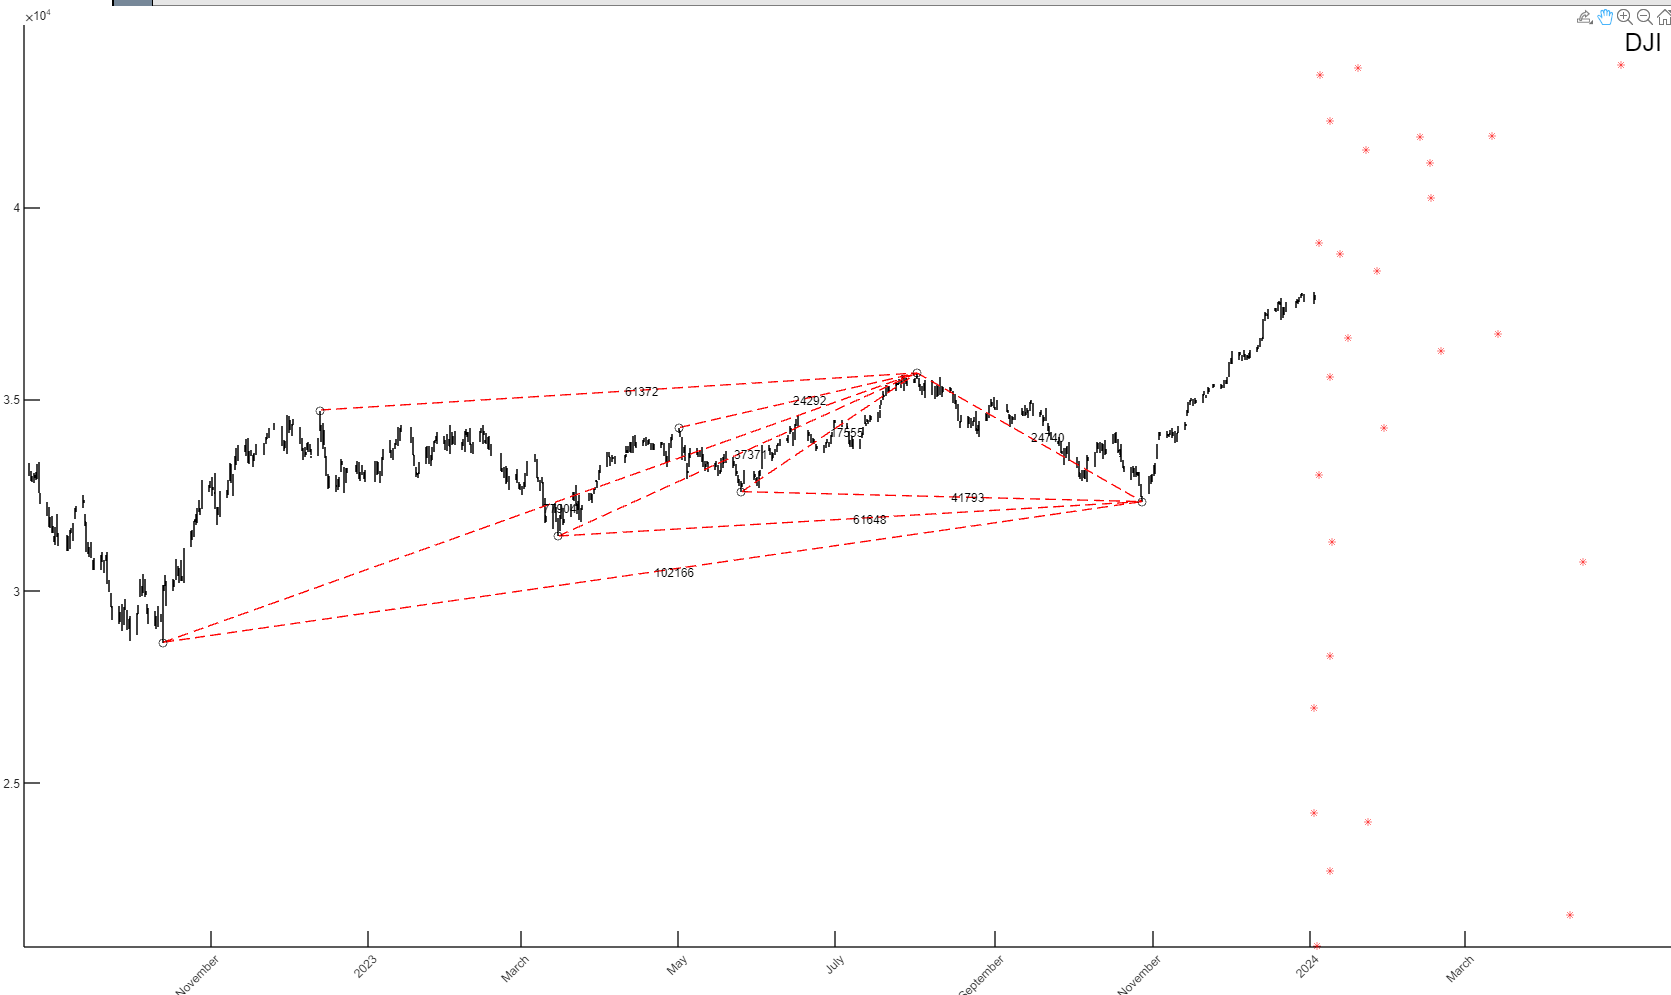
The market continues to behave exactly as our time/price calculations project.

A couple of interesting articles today…….

Stocks & Bonds Tumble After Fed’s Waller Sends Rate-Cut Odds Reeling

    • At first glance, Fed Governor Chris Waller’s comments were more of the same – data-dependent, mini-mission-accomplished, be careful of easing financial conditions, and the market seems over-enthusiastic about 2024 policy. But it was the level of detail he added – and the flip-flop-ish nature of his comments – that colored the market’s perceptions hawkish (full speech here).

Stocks, Bonds, Oil, & Gold All Down As Waller Wrecks Rate-Cut Party

    • Comments by Governor Waller in a speech and discussion today raised the risk that the first cut could come slightly later than the market’s expectation of March and that the pace of cuts could be quarterly from the outset, rather than the market’s more aggressive forecast of three initial consecutive cuts followed by a switch to a quarterly pace.

We made a shocking prediction last week. Not only the FED won’t cut, they will continue to hike, at least for the time being. Here’s why…..

Because the market will force them to.

Keep raising rates….are you out of your mind? Yes and No!!!

Earlier in the day we updated our mathematical Time/Price 10-Year Note (TNX) Forecast You Won’t Believe What Interest Rates Will Do Next

In that forecast, while we do not share exact Time/Price targeting data, we do suggest that TNX hasn’t topped yet or that October’s high was not the final high. In other words, another leg higher is expected.

Here is the thing. The FED tends to follow the market and not lead it. Particularly the short end of the curve. Over the years I have presented a mountain of evidence to support this notion.

Meaning, if our overall TNX calculations are correct, and I have no reason to doubt them, interest rates are about to surge higher one more time. And if so, the FED will follow.

And that, ladies and gentlemen, should get very interesting.

Having said that, if you would like to find out what the stock market will do next, in both price and time, please Click Here.

This Shocking Chart Shows When & Where The Top Will Arrive

As you know, we run a complex set of multi-dimensional calculations in order to identify upcoming turning points in the market.

For instance, the chart above takes prior mid-term moves, calculates them and then projects upcoming turning point into the future. Represented by the red dots above. The trick is to know which one is the actual turning point. 

That is done by converging various TIME turning points with geometric composition of the market. That gives us the final answer. 

So, which dot above is the final top – if any? 

If you would like to find out, please Click Here