Our Next Fast Mover Was Just Posted – Can You Guess From The Chart What It Is

Fast movers are stocks that are about to stage powerful directional moves of 50%+ within a short period of time of 12 months or less. As the chart above suggests, this stock is about to top and then collapse to the tune of 40%+ within 4-6 months.

If you would like to learn more about our fast movers and/or if you would like to see what this stock is, please Click Here

Bitcoin: Watch Out For Mid Cycle Top, Followed By A Major Cycle Bottom

I remember Bitcoin sentiment in January of 2023 when the cryptocurrency was selling at around $18K and everyone was in a full on panic mode. It was crashing. Yet, our mathematical and timing calculations at the time confirmed October bottom and have suggested BTC would push into its mid-cycle top next to arrive in early 2024.

Today, the situation is quite reversed. Open any financial outlet and be immediately inundated with articles about Bitcoin hitting $100K and beyond.

Yet, pay attention to the chart above. In short, Bitcoin is approaching its mid-cycle high. Once it is in, the crypto should collapse into its major cycle bottom, scheduled to arrive towards the end of the year.  In other words, things are not looking good for BTC. At least in terms of our mathematical and timing calculations.

We just posted our updated full analysis for Bitcoin in our MegaCap section. If you would like to see it, including our time/price projections, please Click Here.

Stupid People Are Buying Bitcoin Again???

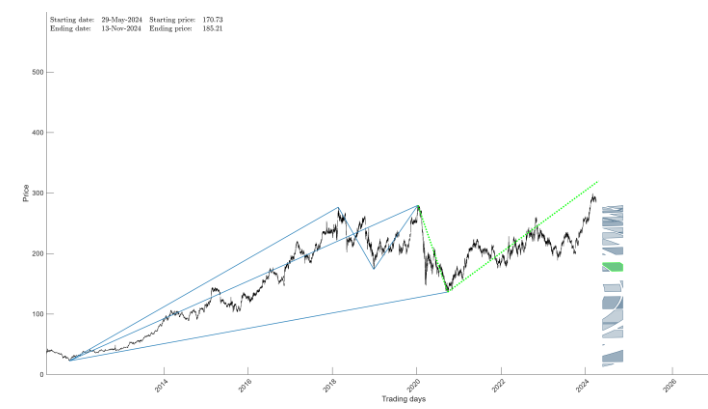
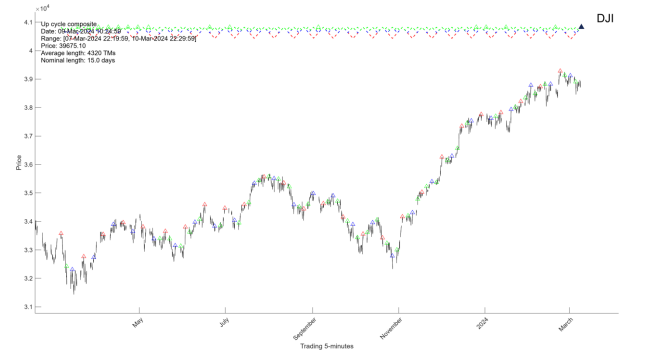
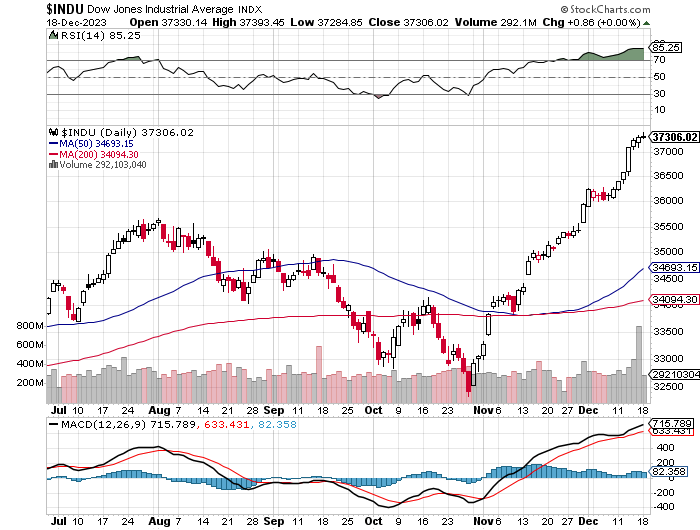
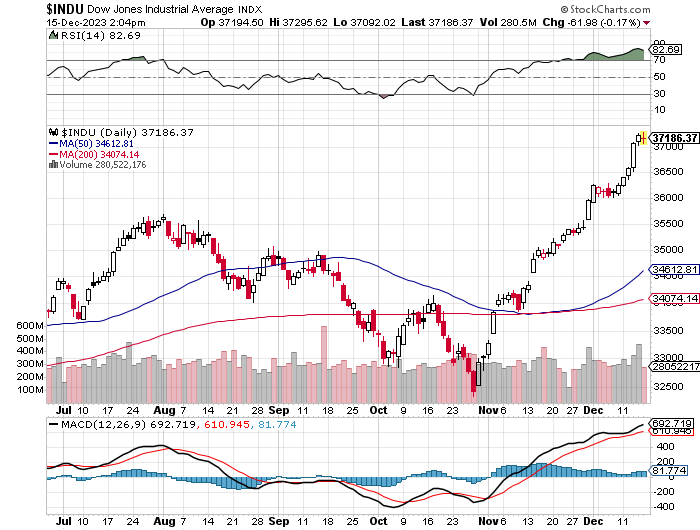
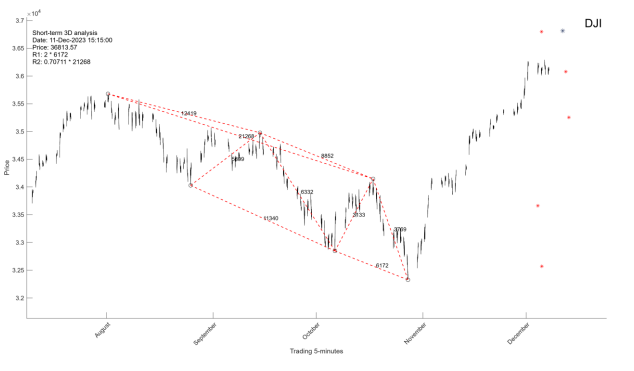
The overall stock market continues to behave as anticipated. If you would like to find out when the stock market will top out, in both price and time, please Click Here

So, picture this: two weeks ago, the crypto world was as confused as a chameleon in a bag of Skittles. Why, you ask? Well, turns out the launch of the long-awaited Bitcoin ETFs triggered a crypto-sell-a-thon of epic proportions. But fear not, dear reader, for we’ve unearthed the culprit behind this digital debacle: none other than the bankrupt FTX, playing a real-life game of “Dump the Assets” with the GBTC Bitcoin Trust.

But hold onto your hats, because amidst the chaos, a glimmer of hope emerged. GBTC outflows slowed down faster than a sloth on a sugar rush, while inflows into new spot Bitcoin ETFs surged like a kid in a candy store. And guess who’s leading the pack? The Fidelity FBTC ETF, raking in a whopping $130 million! That’s more cash than you can shake a blockchain at!

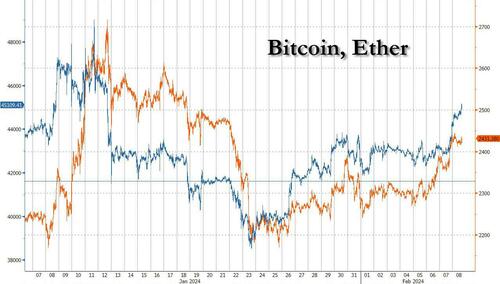
But wait, it gets even better! Bloomberg, the Wall Street oracle, is now singing the praises of ETFs, dubbing them the “chosen ones” with steady inflows. And lo and behold, this morning, Bitcoin strutted its stuff, topping $45,000 for the first time in ages! It’s like watching a digital phoenix rise from the ashes, fueled by the financial fervor of investors with more risk appetite than a goat at a buffet.

And get this: Bitcoin’s dance to the top wasn’t a solo act. It had its trusty sidekick, Ethereum, by its side. Sure, Ether hit a multi-year high of $2700 in January, but then it hit a snag. But fear not, crypto enthusiasts, for Ether is like that sneaky neighbor who always throws the best parties when you least expect it. Standard Chartered predicts it’ll hit $4,000 by May, all thanks to the SEC’s tantalizing promise of Ethereum ETFs.

So, dear reader, buckle up and enjoy the wild ride that is the crypto market. It’s a world where chaos reigns supreme, but every tumble and turn brings with it a hint of hilarity and a sprinkle of hope. After all, in the land of Bitcoin and Ethereum, anything is possible—even if it involves more drama than a soap opera on steroids!

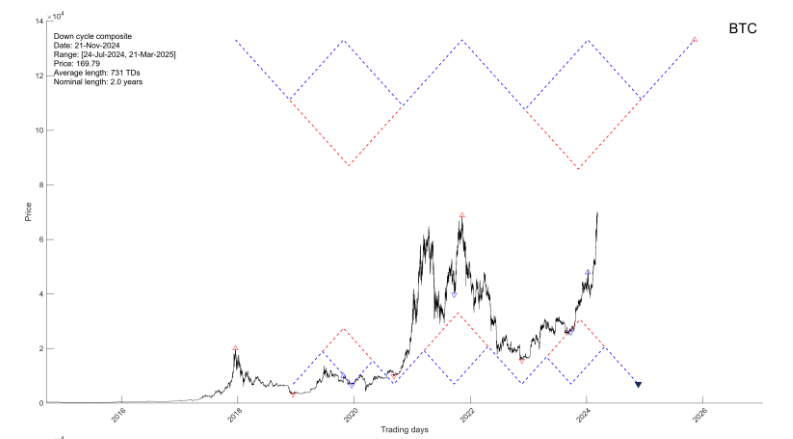
Having said the above, it pays to know exactly what Bitcoin will do going forward. If you would recall, back in February of 2023 we confirmed 2022 bottom and have suggested that BTC would stage a significant bounce, most likely into the 40K range to close prior gap downs.

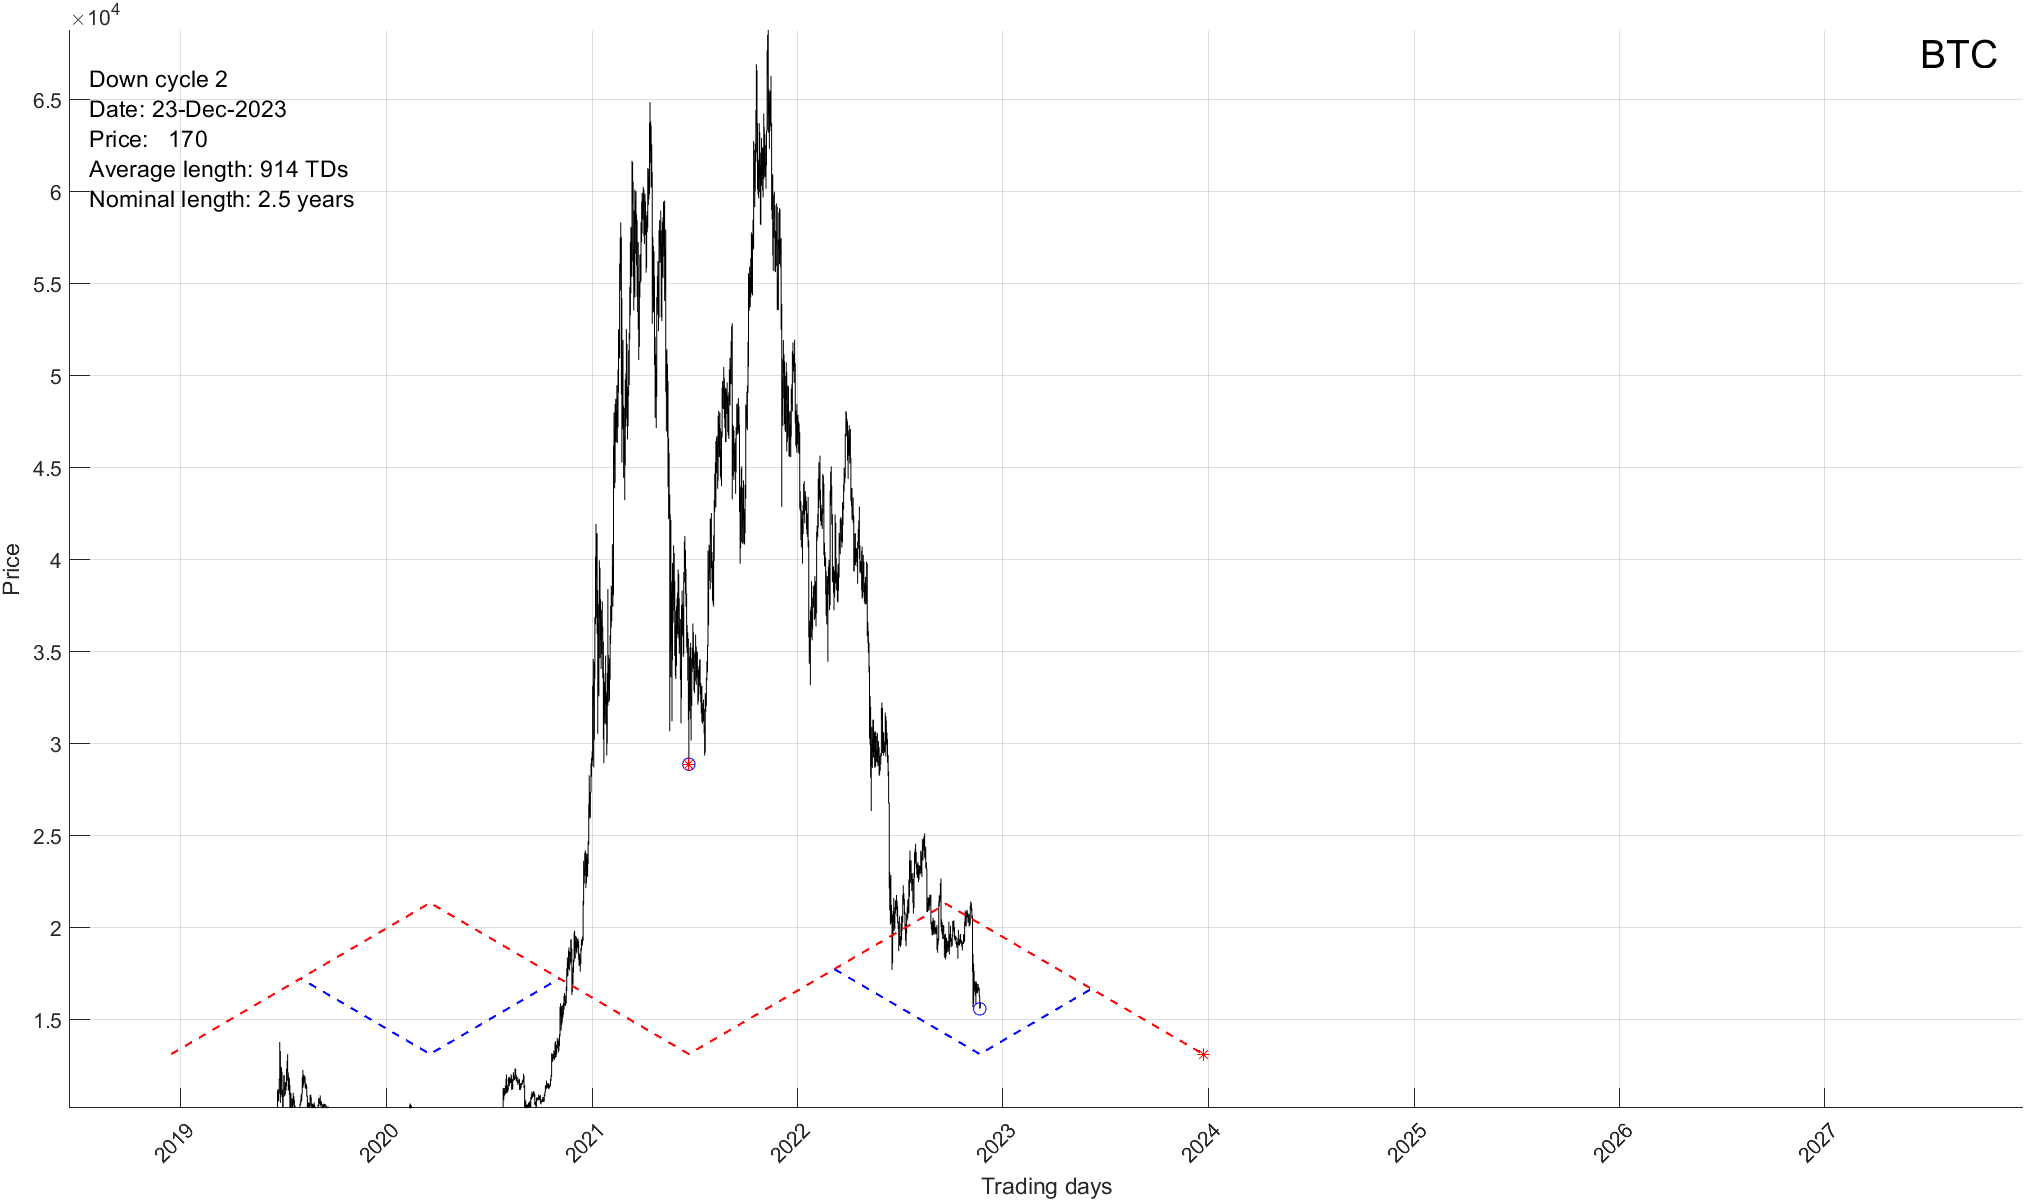
Yet, the rest of the forecast is where it gets interesting. According to our mathematical time and price calculations BTC hasn’t yet put in a major bottom. Not only that, it is quite a bit lower.

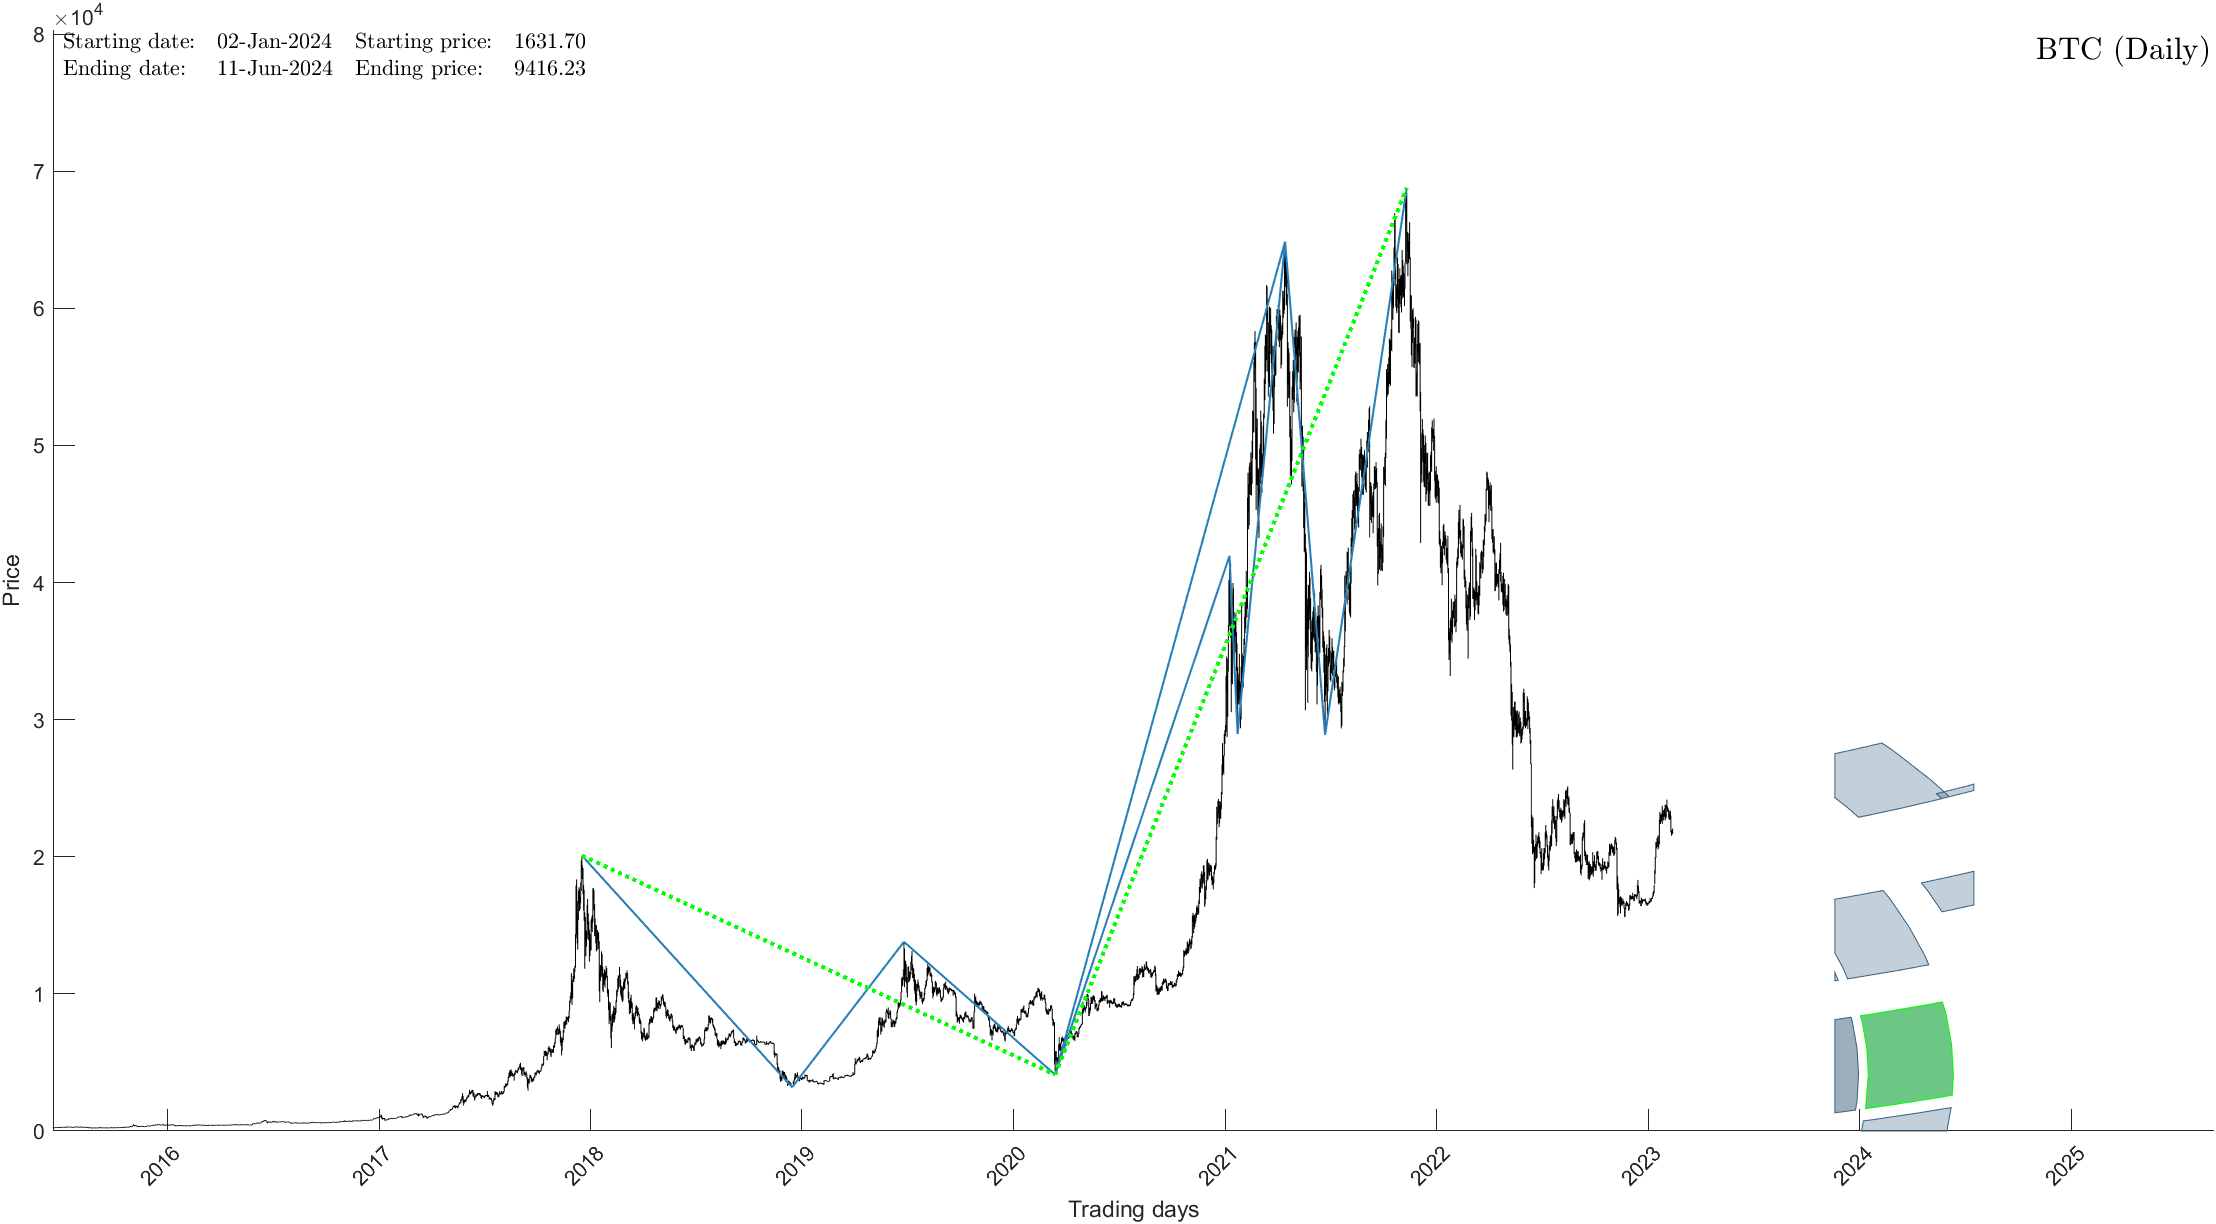
In other words, while the fools are once again projecting Bitcoin to hit $100K and above, you might want to hold off. If you would like to find out what BTC will do next, in both price and time, please Click Here.

Is China About To Bottom ??

1/25/2024 – A positive day with the Dow Jones up 242 points (+0.64%) and the Nasdaq up 28 points (+0.18%) 

The stock market continues to behave exactly as anticipated/projected.

The following data point caught my eye.

China’s Plunge-Protection Team Buys Billions In ETFs To Halt Market Rout

    • “The national team is likely stepping to stabilize the market as they have done in previous market crashes,” said Marvin Chen, a strategist at Bloomberg Intelligence.
    • And as Beijing bought, foreign investors were again aggressive sellers of mainland stocks after they dumped 13 billion yuan ($1.8 billion) worth of shares in the previous session, the most in more than a year.
    • Meanwhile, the Hang Seng China Enterprises Index finished the day 0.8% higher, reversing an earlier decline of 0.6%. Down 10% this year, the HSCEI gauge is the world’s worst-performing major index. As for the CSI 1000, it was the familiar diagonal “PPT is here” line as Beijing didn’t leave any doubt about its presence.

I found it interesting because according to our mathematical time and price calculations Shanghai SE is about to bottom and stage a powerful rally.  We wrote about it a little while ago.

Our mathematical and timing analysis for Shanghai Stock Exchange (SSE) shows the following……

    • SSE is currently moving into its mid-cycle bottom scheduled to arrive on XXXX.
    • Our mathematical calculations suggest the bottom will arrive around XXXX (+/- 50 points)
    • Once the bottom is put in place SSE should rally into its next mid cycle top, scheduled to arrive in 2025. 
    • Our calculations suggest SSE will run up to at least XXXX by 2025. 

In summary, Shanghai Stock Exchange is bottoming very soon. Once the bottom is put in place SSE should rally into a mid-cycle top by XXXX of 2025. A long-term double top formation at that juncture is likely.

If you would like to see our exact Time/Price targets for Shanghai SE, please Click Here

End Of Day Market Update & Why The US Dollar Will Not Crash – Yet

12/18/2023 – A positive day with the Dow Jones up 1 point (+0.01%) and the Nasdaq up 90 points (+0.61%) 

It is rather entertaining, but today’s top on the NDX has matched its January of 2022 counterpart to the point. No breakout yet. Having said that, it is a little beside the point. As we have mentioned before, we now have numerous confirmation that both the NDX/SPX will see their respective all time highs.

The Dow pushed slightly above its Intraday short-term point of force discussed in our Intraday analysis.  Although, it remains within the margin of error and cannot yet be fully dismissed. Meaning, while it is possible we get a pullback here, that possibility has greatly diminished short-term since we have pushed slightly above this short-term point of force. If we push higher tomorrow, this will be confirmed and the rally will continue.

No other changes to our longer-term weekly and prior daily updates.

The above section is a short excerpt from our Subscriber Analysis. If you would like to see the rest and if you would like to find out exactly when and where the top will arrive, please click on this link 

Now, I found the following article of great interest…….

Visualizing $97 Trillion Of Global Debt In 2023

Country Gross Debt (B) % of World Total Debt to GDP
🇺🇸 U.S. $33,228.9 34.2% 123.3%
🇨🇳 China $14,691.7 15.1% 83.0%
🇯🇵 Japan $10,797.2 11.1% 255.2%
🇬🇧 UK $3,468.7 3.6% 104.1%
🇫🇷 France $3,353.9 3.5% 110.0%
🇮🇹 Italy $3,141.4 3.2% 143.7%
🇮🇳 India $3,056.7 3.1% 81.9%
🇩🇪 Germany $2,919.3 3.0% 65.9%
🇨🇦 Canada $2,253.3 2.3% 106.4%
🇧🇷 Brazil $1,873.7 1.9% 88.1%
🇪🇸 Spain $1,697.5 1.7% 107.3%

I found the above of interest in terms of the US Dollar. Quite a few market participants believe the US Dollar is not worth the paper it is printed on and will soon crash. As accurate as that opinion might be, it flies in the face of our DXY forecast – at least for now. 

What the above data shows is that all major economies are stuck in the same boat and that other currencies are arguably “just as bad”. In other words, the US Dollar cannot crash against other currencies that are suffering from the same problem. And once again – YET.

Our DXY forecast is rather unique in that sense and shows USD movements going forward that no one is anticipating. If you would like to see that forecast, please Click Here and select our MegaCap Section.   

Will The Stock Market Keep Surging Higher – Find Out

A positive day with the Dow Jones up 56 points (0.15%) and the Nasdaq up 52 points (+0.35%) 

It appears most investors and professional money managers are quite confused about what’s going on with the overall stock market. 

Wasn’t it supposed to crash in November?

With some going as far as coming up with some outlandish theories or cause and effect propositions in an attempt to explain or predict what the stock market will do next. 

Case and point, this beauty from ZeroHedge….

Will The Fed’s Coming Rate Cuts Lead To Higher Stock Prices? It Depends On Just One Thing

Will the US economy be in a recession in 2025, and by extension will Trump be president.

So, blame the Orange Man.  And while at it why not blame Putin for this “crazy” market environment.  

In reality, the stock market is doing exactly what it should be doing. At least according to our timing and mathematical work. In mid 2022 our mathematical calculations yielded the following projection. 

“The stock market will bottom on October 10th, 2022 (+/- 2 trading days) and then run up to an all-time high, breaking above January 2022 top in 2023.”

The actual bottom arrived in the first 30 minutes of trading in October 13th and the rest, as they say, is history. 

In our opinion or based on our calculations what the stock market will do next is crystal clear and quite interesting.  And it has nothing to do with interest rates. Well, it kind of does or at least there has been a historic correlation. 

Was the FED cutting or raising rates in 2000-2002 and 2007-2009. Cutting – right!!! Point being, just because the stock market has apparently survived this interest rate rising cycle, doesn’t mean the stocks are ready to run higher. In fact, quite the opposite is true. 

Our mathematical and timing work confirms this conclusion. If you would like to find out exactly where and where the stock market tops out, and what happens next, please Click Here


Our Next FAST MOVER Is Ready To Go

Over the years we have been able to figure out a way of identifying Fast Moving stocks. These are stocks that are about to stage powerful directional moves of 50%+ within a compressed time window of 12 months or less. To learn more about our fast movers and the math behind it, please Click Here

Charts below represent our latest find. If you recognize the charts, great. The stock in question is about to bottom and then proceed to surge 200% + over the next 10-12 months. 

If you would like to obtain the exact time/price target for this upcoming bottom as well as our trading parameters, please Click Here

If you would like to find out what the stock market will do next in both price and time, long-term and short-term, please Click Here.  You can also find our MegaCap Stocks Time/Price Projections and our Fast Movers at the same link.

The Market Continues To Perform Just As Anticipated

Back in the early second half of 2022 most people laughed at our October 10th (+/- 2 trading days) bottom projection. A bottom? Most investors were doom and gloom at the time.

Now, the situation is kind of reversed.  I say “kind of” because most investors I know are kind of in disbelief that despite today’s fundamental factors and the overall state of the economy the market keeps climbing higher. So much so that quite a few people I know have given up on trying to figure out what the stock market will do next.

In our opinion the setup is rather simple and something that we have maintained for well over a year. In other words, the market is developing as it should. If you would like to find out what happens next, in both price and time, please Click Here 

If you would like to find out what the stock market will do next in both price and time, long-term and short-term, please Click Here.  You can also find our MegaCap Stocks Time/Price Projections and our Fast Movers at the same link.