
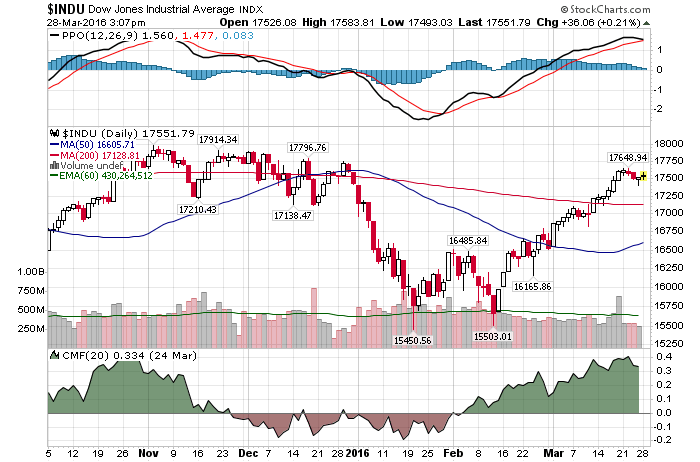
3/28/2016 – A mixed day with the Dow Jones up 19 points (+0.11%) and the Nasdaq down 7 points (-0.14%)
The Dow topped out on October 11th, 2007 at 14,280. By March 6th, 2009 it was sitting at 6,460 or with a 55% loss. But here is what’s interesting. The imbalances we are witnessing today are exponentially greater than what we saw in 2007-2009. Consider the following……
2007 Imbalances:
-
U.S. government debt (as narrowly defined) stood about $8 trillion.
- The Federal Reserve’s balance sheet was under $800 billion.
- 10-year Treasuries yielded approximating 4.5%, giving the Fed had some leeway to cut interest rates if necessary to fight a crisis or business downturn.
- The subprime-mortgage bubble peaked at about $1.3 trillion.
- Aggregate government debt was under $10 trillion.
- The derivatives market’s notional value was $182 trillion.
- A homeless man named Johnny Moon was reportedly able to get some $600,000 of mortgages to speculate in the U.S. housing market.
As bad as all of that was, consider Today’s Imbalances:
- U.S. government debt totals about $19 trillion, or some $11 trillion more than it was in 2008.
- The Fed’s balance sheet is approaching $5 trillion vs. $800 billion in 2008.
- Short-term interest rates are 0.25% compared to 4.5% back in the day. With interest rates at near-record lows, there’s little opportunity for the Fed to further expand its balance sheet.
- The derivatives market is currently larger than $500 trillion vs. $182 trillion in 2008.
- Central-bank capital has dropped to 0.8% of assets from 4.5%.
- The size of the subprime bubble was $1.3 trillion, but the size of sovereign borrowing is $7 trillion today.
- Our government has to borrow money to simply pay interest, and monetary policy is hamstrung by near-zero interest rates.
- There are no more homeless people getting mortgages to buy homes, but there’s a Danish sex therapist whose bank is paying her interest (instead of the other way around) on a loan that’s financing her matchmaking Web site.
Not a big deal???
I would certainly disagree. The imbalances above will have to be addressed one way or another. They will not simply go away. We do not live in a magical world where the FED geniuses have created a perpetual money machine.
If anything, it is highly probable, especially if you consider today’s general overvaluation levels, that the imbalances above will be addressed in a violent fashion. And I would say sooner rather than later.
This conclusion is further supported by my mathematical and timing work. It clearly shows a severe bear market between 2015-2017. In fact, when it starts it will very quickly retrace most of the gains accrued over the last few years. If you would be interested in learning when the bear market of 2015-2017 will start (to the day) and its internal composition, please CLICK HERE.
(***Please Note: A bear market might have started already, I am simply not disclosing this information. Due to my obligations to my Subscribers I am unable to provide you with more exact forecasts. In fact, I am being “Wishy Washy” at best with my FREE daily updates here. If you would be interested in exact forecasts, dates, times and precise daily coverage, please Click Here). Daily Stock Market Update. March 23rd, 2016 InvestWithAlex.com
Did you enjoy this article? If so, please share our blog with your friends as we try to get traction. Gratitude!!!

One Reply to “2007 Top Vs. Today. Just How Bad Is It?”
Comments are closed.